APEX crossed a major threshold today. For the first time, following an ill-advised all-nighter, I extracted quantifiable visual features—symmetry, complexity, curvature—from a set of five Greek inscriptions, 184 characters in all. It’s the moment I’ve been working toward for the past two months: a proof of concept that moves APEX from idea to implementation.
What Happened
This first round of feature extraction focused on five samples: four vector drawings I created myself, and a small segment of the Dipylon inscription from a published drawing. That last one is a significant breakthrough—if published drawings are usable for analysis, I can drastically reduce the time bottleneck that comes from manual tracing.
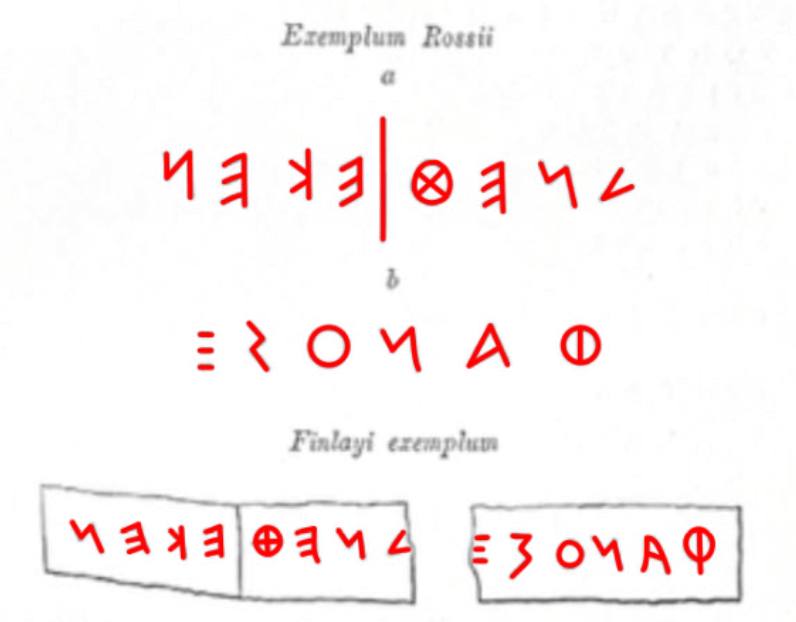
I started with scans from Euboea and Athens, primarily sourced from Inscriptiones Graecae volumes, the major corpus of Greek inscriptions. I then imported them into Adobe Fresco and traced them by hand with a digital vector brush. This was challenging—my hand isn’t always precise—but with enough care and layering, I got the fidelity I needed. The Dipylon test was drawn by someone else, and its inclusion opens the door to semi-automated corpus growth.
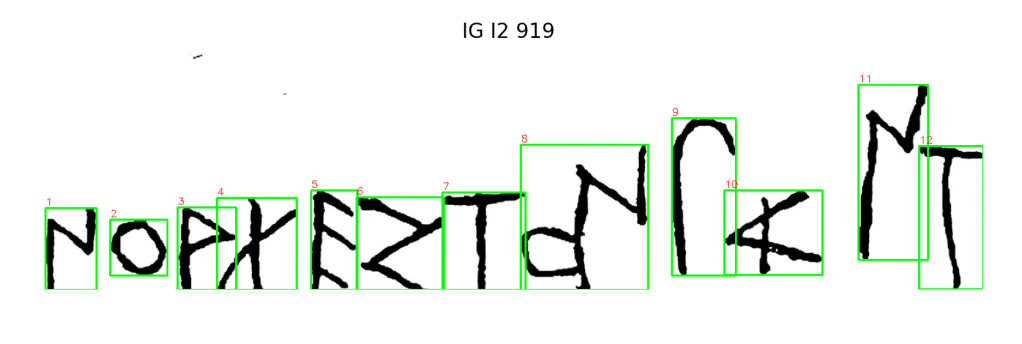
Figure 2. Letter bounding boxes from the earliest Athenian inscription, successfully ordered left-to-right. 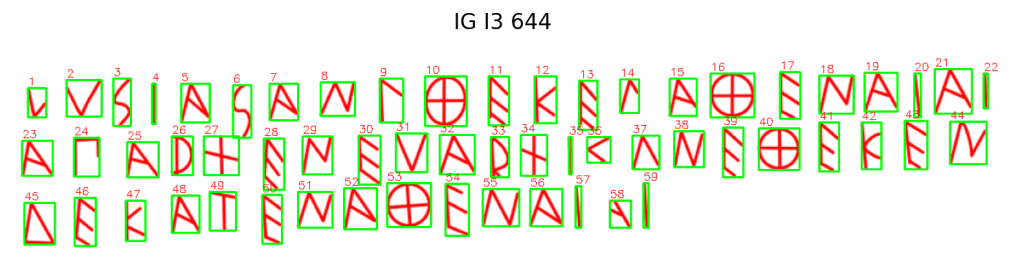
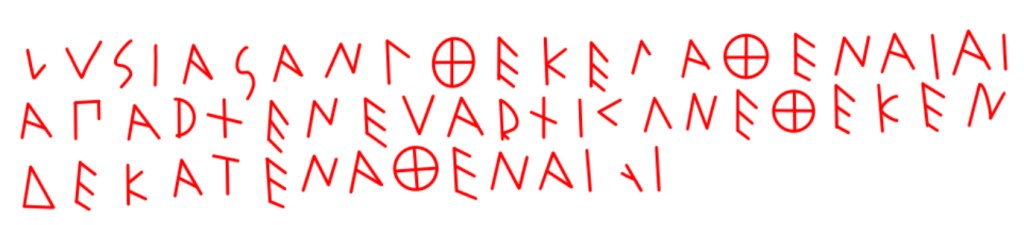
Figure 3. An Athenian dedicatory base of a statue. It includes 59 letter-tokens. 
Figure 4. This short Euboean inscription was one of the first processed for full feature extraction, including curvature and roundness. 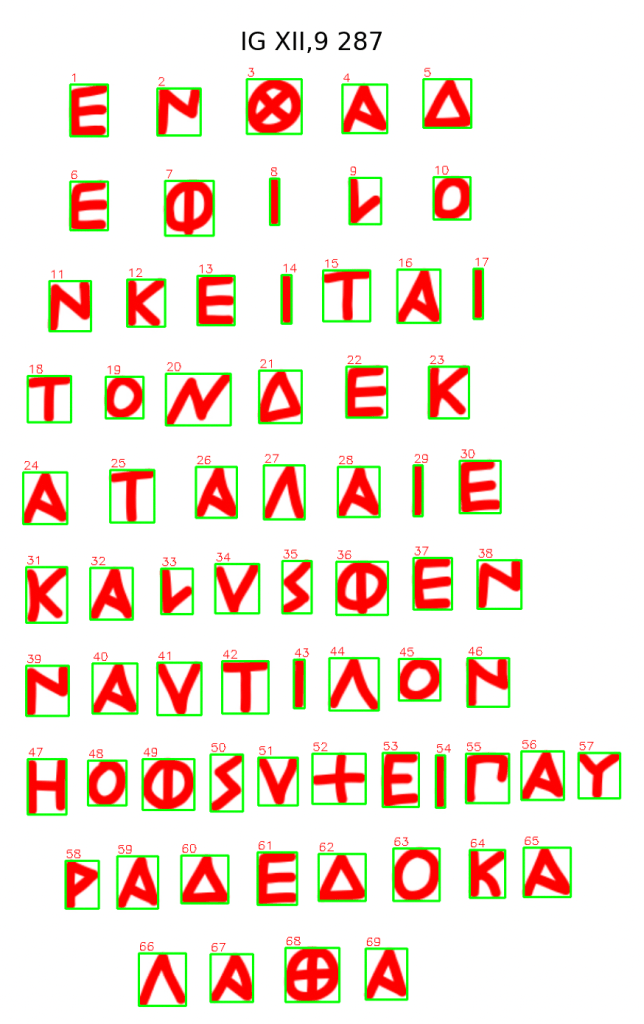
Figure 5. This Euboean inscription contains 69 letters—making it the longest in the current dataset. 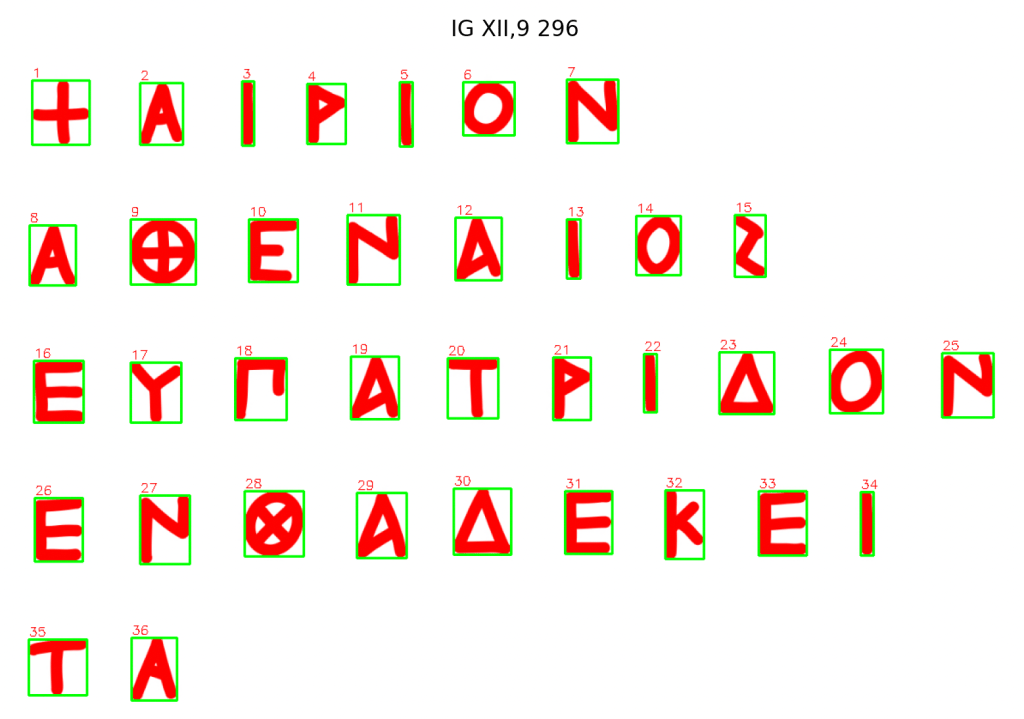
Figure 6. This example shows clear stroke preservation and consistent spacing across multiple lines, enabling token-level analysis.
Each inscription was automatically segmented by the program. Achieving correct sequence alignment across cropped letter images was a key step in building inscription-level feature maps. The images above represent the first full inscriptions processed through the bounding box pipeline.
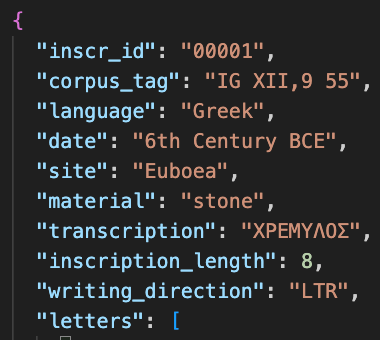
Then, it was exported to JSON in the following structure:
Feature Design and Scoring
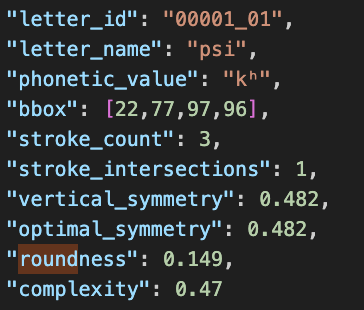
I’ve defined and implemented several key metrics for each letterform:
- Stroke Count – manually input
- Stroke Intersections – manually input
- Vertical Symmetry – computed numerically
- Optimal Symmetry – tested across axes every 15° to find the best alignment (a computing-efficient approximation)
- Roundness – computed using gaussian_filter1d
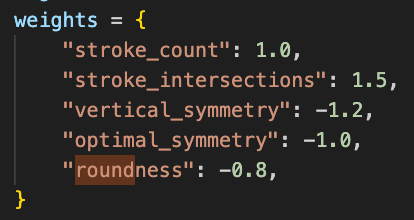
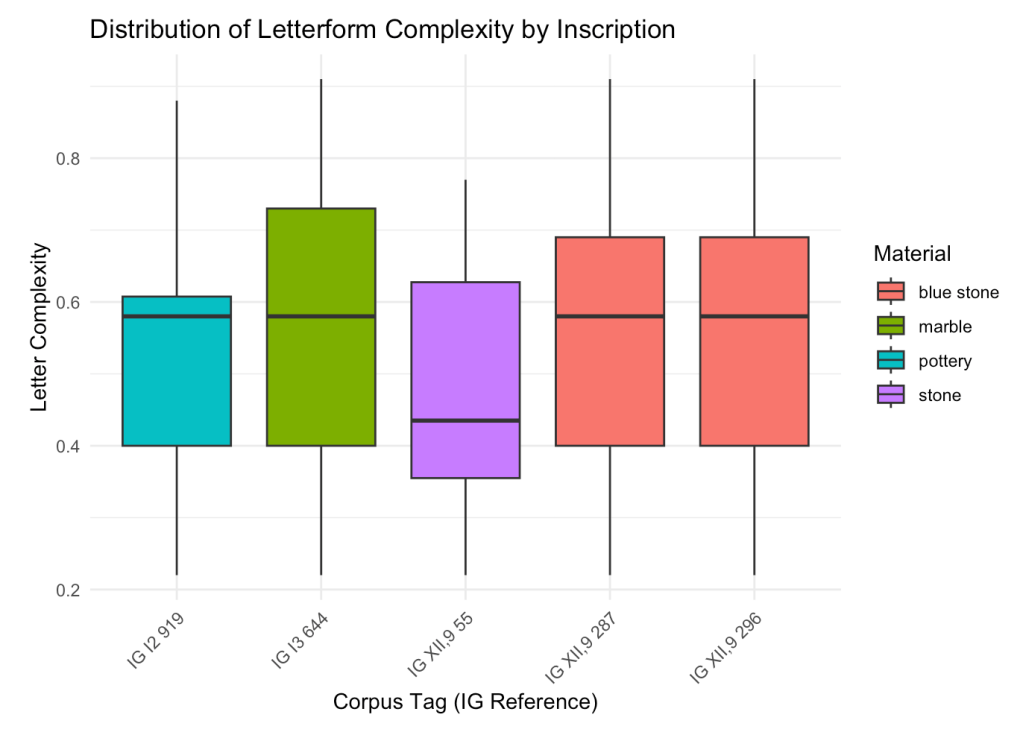
- Complexity – a weighted composite of the above:
All features exist on a 0–1 scale for interpretability, except for the integer values (stroke count and intersections).
Corpus as of Yet
- 5 inscriptions, ranging from 8 to 69 characters each
- 184 letter-tokens total
- Euboea (3) and Athens (2) represented
- Time span: 4 from the 6th century BCE, plus one from the mid-8th century BCE (Athens’ Dipylon Oinochoe inscription)
Why It Matters
APEX is built on the belief that we can do more than just describe the evolution of early scripts—we can measure it. Traditional paleography has long relied on trained visual intuition, the expert eye that can recognize when a letterform “feels” earlier, or more formal, or distinctly local. But those impressions are rarely made explicit. What does “formal” actually mean, visually? How do we know when a script is evolving—and what evidence grounds that claim?
By extracting features like symmetry, stroke logic, and curvature, APEX moves us from descriptive typology to quantitative analysis. My goal isn’t to flatten nuance, but to build a system where human expertise and computational insight support each other. With interpretable, scaled scores, we can track visual patterns across time, region, and even individual inscriptions. This opens the door to:
- Comparing sites and styles numerically
- Generating new hypotheses about regional transmission
- Detecting stylistic outliers that may point to forgery, imitation, or cultural contact
It also challenges long-held assumptions in the field. Dating inscriptions, for example, often involves matching a given form to an established visual lineage—but this can slip into circular logic. If “archaic” forms are defined by early dates, and dates are inferred from “archaic” forms, then the system reinforces itself without new evidence. APEX introduces a third axis: one grounded in measurable, replicable features. That doesn’t replace context or typology—it adds another layer of rigor.
Dipylon: When the Data Doesn’t Flinch
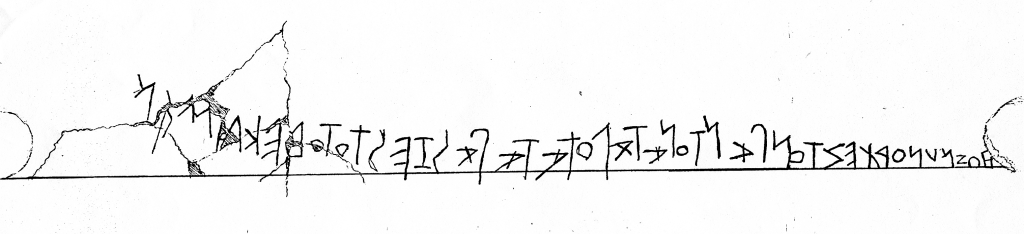
One of the earliest inscriptions I’ve run through the system is also one of the most famous: the Dipylon inscription, dated to the mid-8th century BCE and long celebrated as a watershed moment in the history of the Greek alphabet. It’s an obvious case study, and I expected it to stand out—visually unstable, perhaps overly complex, the kind of thing you’d expect from a script just finding its footing.
But it didn’t.
Dipylon came back as less complex than three of the four texts from 150–250 years later. Not radically so, and I’ll need to test for statistical significance. But the fact that it falls anywhere below later forms is striking. It disrupts the deeply embedded assumption that “early” equals “primitive”—that the alphabet grew from mess into order.
This kind of result is both clarifying and disorienting. It raises a fundamental question about how we define the very metrics we use: what counts as complexity? In APEX, complexity is a weighted composite: more strokes, more intersections, less symmetry, less roundness—these push a letter’s complexity score higher. But those weights are a human decision, my human decision, reflecting a particular theory of visual burden.
I can tune them to better match expert judgment. Or, I can sit with the discomfort when the numbers disagree with what I thought I’d see.
There’s also a caveat that matters: we’re not yet comparing like to like. Right now, the comparison is inscription-to-inscription, which is useful for spotting broad patterns but noisy when it comes to fine-grained typology. Ideally, I’ll be comparing the same letterform, in the same variant, across multiple inscriptions. I have a strong hunch that’s where the real insights will come from.
Until then, Dipylon’s ordinariness serves as provocation and placeholder—reminding us that the past might not be as unruly as we imagine.
What’s Next
This first round of feature extraction was a proof of concept. Now it’s time to scale. Over the next few months, I’ll:
- Expand the corpus with more inscriptions from across regions and time periods
- Refine the complexity formula, testing both against intuition and against formal criteria
- Build a more granular comparison framework, starting with letterform-to-letterform tracking across inscriptions
- Prototype an interface to allow structured uploads, human-guided segmentation, and visual feedback
I’m also starting to explore how this data could be used for classification—predicting likely region or century from featural profiles—and what it might take to integrate drawing-based OCR into the workflow for automatic metadata tagging.
The goal isn’t just to process more data. It’s to move toward a toolset that scholars, students, and researchers can use to test hypotheses, challenge assumptions, and see the alphabet’s evolution in a more legible form.
Closing Thoughts
Watching these ancient forms transform—first into vectors, then into numbers, then into patterns—has been equal parts exhilarating and disorienting. APEX is still in its early stages, but already the project is doing what I hoped it would: not just confirming what we think we know, but pressing against it.
There’s still a long way to go. The features need refining. The comparisons need tightening. The visual logic of scripts can’t be reduced to numbers alone. But I believe quantification, when done carefully and transparently, can serve as a new lens. This isn’t the end of the story—just the moment the letters started speaking back.

Leave a reply to APEX Updates, 9: Lunar Letters: Gradation, Gradation—and Then a Sudden Leap – To Wake the Dead Cancel reply