For the first time, an entire epigraphic corpus—not just a sample—has been processed through the complete APEX pipeline: from manual tracing to feature extraction, metadata encoding, and statistical analysis. The result is a framework capable of quantifying local graphic style at unprecedented scale.
From Corpus to Dataset
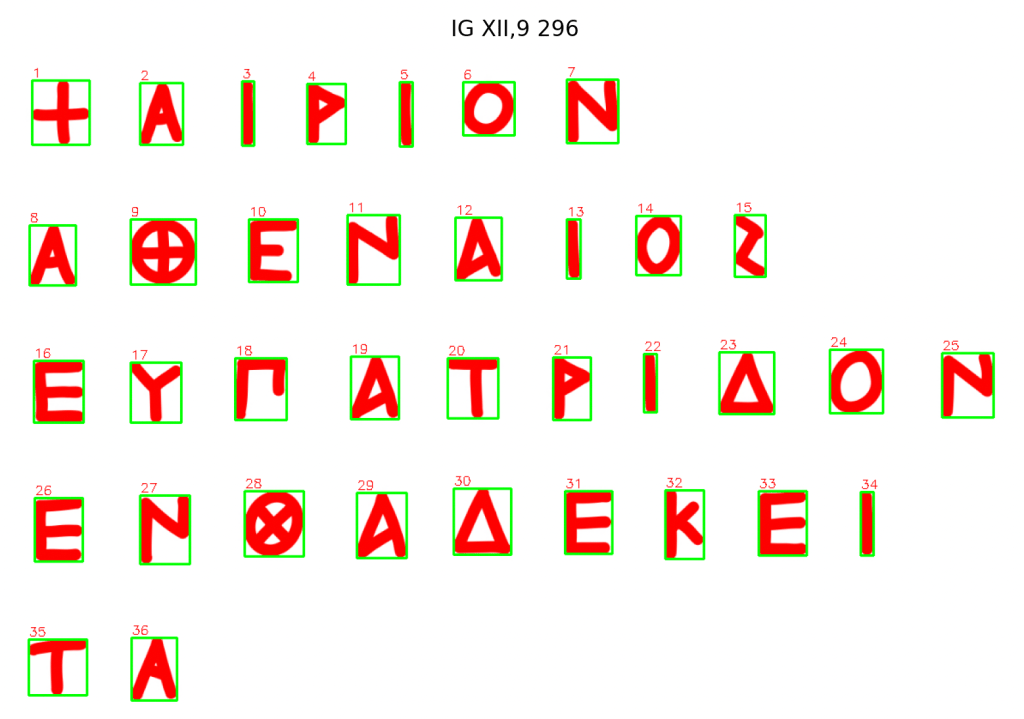
Each tablet began as a published facsimile in Inscriptiones Graecae XII.9. Every letter was re-drawn in vector form and imported into the APEX 1.9 environment, where bounding boxes, glyph metadata, and geometric features were extracted.
The result is a dataset of nearly 60,000 individual measurements, capturing symmetries, curvature, stroke logic, and complexity across the full inventory. These data enable formal comparison among letter types and across inscriptions—transforming what was once qualitative observation into quantifiable structure.
Patterns in Form
Several clear patterns emerge from the Styra analysis:
Symmetry and complexity show a strong inverse relationship. This correlation is predictable from the model itself, which rewards more symmetric forms with lower complexity scores (p. 1). I am still refining the weighting of this relationship (pp. 5–6), as symmetry’s contribution may be disproportionate to its theoretical coefficient.
Letters whose prototypical forms balance around a central axis tend toward lower complexity scores, though theta is a notable exception. Others—particularly beta and rho—show the expected increase with intersections and irregularity.
Roundness contributes variably to complexity, despite the formula’s explicit bias toward smoother contours. A D-shaped delta, for instance, has fewer strokes than a three-stroke Δ, as a single rounded arc replaces two straight segments (p. 7).
The way this roundness paradox resolves depends on prototypicality. Omicron and iota illustrate opposite tendencies: a rounder omicron is closer to its ideal form—fewer strokes, greater symmetry—while a rounder iota deviates from its single-stroke ideal, disrupting rather than enhancing regularity.
Within a single inscription, the internal consistency of execution can be measured by comparing like forms to like forms—omicron to omicron, for example, as on pp. 8–9. This insight provides the basis for a more formal measure of intra-inscriptional coherence, developed further in a forthcoming diachronic study of eight centuries of Euboean writing.
Finally, the most typical glyph for a given letter can be identified by calculating its Euclidean distance from the corpus mean (pp. 9–10).
The result confirms long-standing epigraphic intuitions, but does so with replicable metrics, complementing stylistic description.
Why Styra Matters
Styra’s tablets are small objects with large implications. Their relative heterogeneity, uniform medium, and chronological focus make them ideal for testing APEX’s capacity to model scribal behavior statistically. They also anchor the project’s broader Euboean dataset, providing a baseline for diachronic comparison.
By measuring how local conventions stabilized and where they flexed, APEX can begin tracing how the same principles of symmetry and reduction evolved across method—painted, carved, incised—and time.
This corpus establishes APEX as a functioning research instrument. Each glyph’s numerical record links directly to its image, provenance, and interpretive metadata. In this sense, letters become experiments—reproducible, contestable, and therefore newly scientific.
Next Steps
Upcoming phases will extend this model to additional Euboean sites, later centuries, and comparative Phoenician material, testing whether regional graphic “balance” can serve as an index of contact and adaptation. As APEX scales up and out, Styra remains its foundation: the first place where the alphabet was measured.
Every field begins when a question grows too large for its parent disciplines. Paleographemics is the study of writing in that moment of expansion—when paleography, epigraphy, linguistics, and computer science meet to ask new, shared questions about how scripts evolve.
Paleographemics focuses on the grapheme in motion: the letterform not as a static image but as something that changes across time, region, and material. It examines how shapes shift, how scribal habits migrate, and how alphabets adapt to new languages and tools. Where traditional paleography relies on typology and intuition, paleographemics introduces quantification—measuring graphical features such as curvature, junctions, aspect ratio, and complexity to compare and model forms systematically.
This approach builds on existing epigraphic and paleographic traditions rather than replacing them. It transforms long-standing qualitative insights into datasets that can be explored, visualized, and tested. Its methods draw from computer vision and network analysis, but its aims remain humanistic: to understand how people wrote, copied, and recognized letters, and what those visual decisions reveal about contact and continuity among cultures.
At its center is APEX—the Alphabetic Paleography Explorer—a platform designed to document and analyze letterforms across the ancient Mediterranean. APEX brings together inscriptions from museums, corpora, and archives into a unified, searchable, feature-extracted corpus. It offers both a research environment for specialists and a foundation for future large-scale analysis of script evolution.
Paleographemics invites collaboration among historians, linguists, archaeologists, and digital humanists. It values transparency, reproducibility, and the combination of quantitative and qualitative reasoning. Its goal is simple but far-reaching: to give scholars new ways to trace how writing changes—slowly, unevenly, and meaningfully—over time.
Welcome to Paleographemics: the science and art of how letters change.
APEX crossed a major threshold today. For the first time, following an ill-advised all-nighter, I extracted quantifiable visual features—symmetry, complexity, curvature—from a set of five Greek inscriptions, 184 characters in all. It’s the moment I’ve been working toward for the past two months: a proof of concept that moves APEX from idea to implementation.
What Happened
This first round of feature extraction focused on five samples: four vector drawings I created myself, and a small segment of the Dipylon inscription from a published drawing. That last one is a significant breakthrough—if published drawings are usable for analysis, I can drastically reduce the time bottleneck that comes from manual tracing.
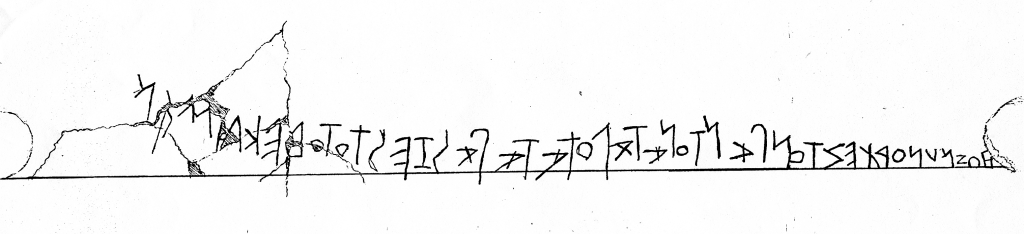
Figure 1. My tracing of a Euboean inscription segment from the IG, with red overlay for analysis.
I started with scans from Euboea and Athens, primarily sourced from Inscriptiones Graecae volumes, the major corpus of Greek inscriptions. I then imported them into Adobe Fresco and traced them by hand with a digital vector brush. This was challenging—my hand isn’t always precise—but with enough care and layering, I got the fidelity I needed. The Dipylon test was drawn by someone else, and its inclusion opens the door to semi-automated corpus growth.
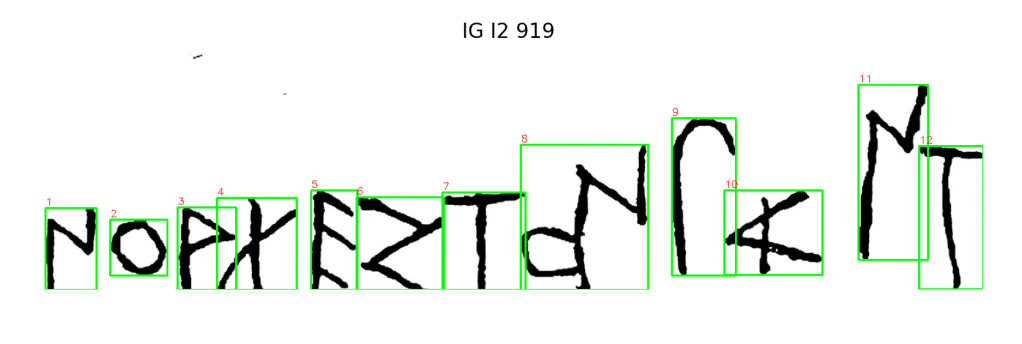
Figure 2. Letter bounding boxes from the earliest Athenian inscription, successfully ordered left-to-right.
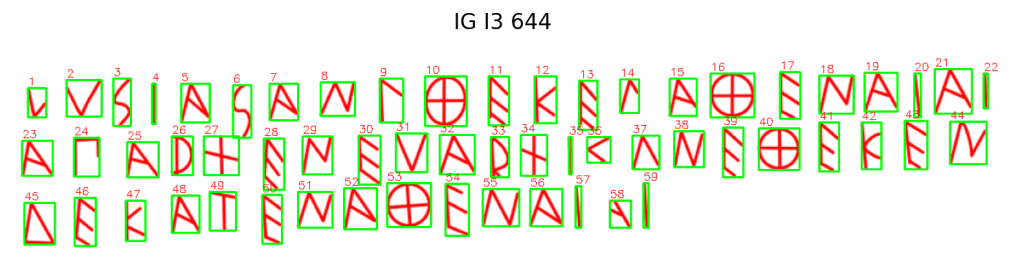
Figure 3. An Athenian dedicatory base of a statue. It includes 59 letter-tokens.
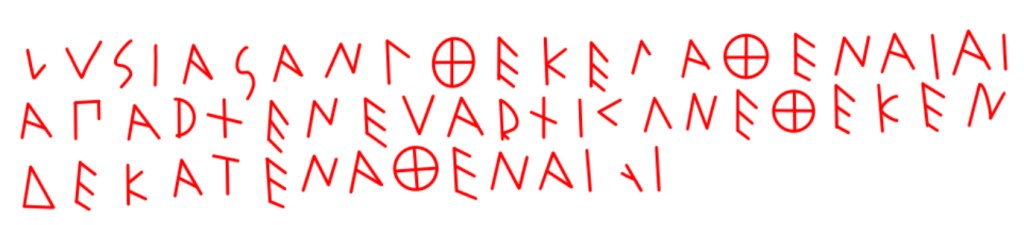
Figure 4. This short Euboean inscription was one of the first processed for full feature extraction, including curvature and roundness.
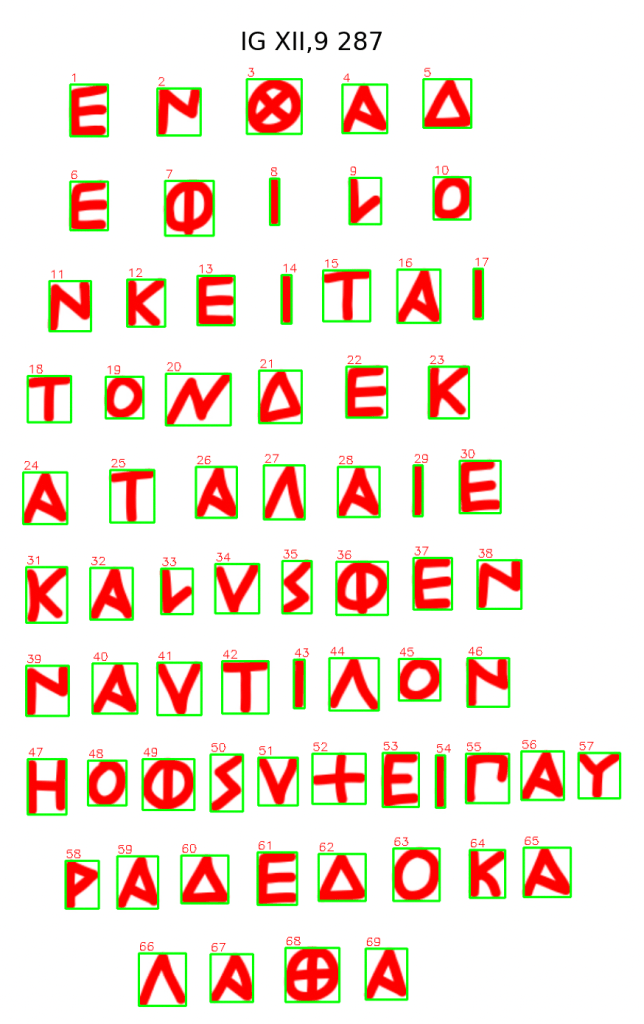
Figure 5. This Euboean inscription contains 69 letters—making it the longest in the current dataset.
Figure 6. This example shows clear stroke preservation and consistent spacing across multiple lines, enabling token-level analysis.
Each inscription was automatically segmented by the program. Achieving correct sequence alignment across cropped letter images was a key step in building inscription-level feature maps. The images above represent the first full inscriptions processed through the bounding box pipeline.
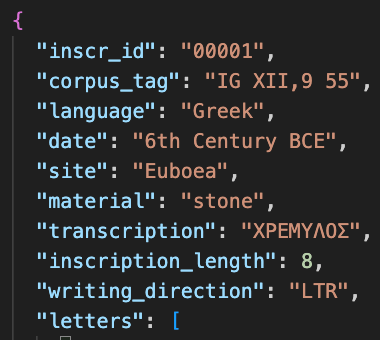
Then, it was exported to JSON in the following structure:
Figure 7a. This entry records provenance, date, material, transcription, and layout details used in corpus-level analysis.
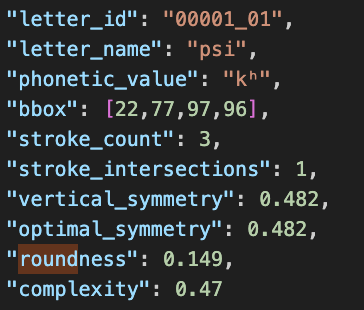
Figure 7b. Extracted features for the letterform “psi”. Each score is used in downstream comparison models.
Feature Design and Scoring
I’ve defined and implemented several key metrics for each letterform:
Stroke Count – manually input
Stroke Intersections – manually input
Vertical Symmetry – computed numerically
Optimal Symmetry – tested across axes every 15° to find the best alignment (a computing-efficient approximation)
Roundness – computed using gaussian_filter1d
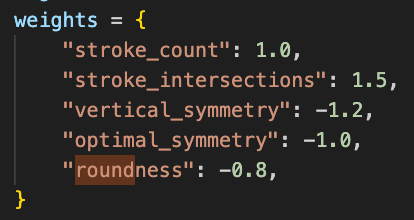
Complexity – a weighted composite of the above:
Figure 8. Scheme used to compute letterform complexity. Each feature contributes positively or negatively to the final score, reflecting its assumed visual impact.
All features exist on a 0–1 scale for interpretability, except for the integer values (stroke count and intersections).
Corpus as of Yet
5 inscriptions, ranging from 8 to 69 characters each
184 letter-tokens total
Euboea (3) and Athens (2) represented
Time span: 4 from the 6th century BCE, plus one from the mid-8th century BCE (Athens’ Dipylon Oinochoe inscription)
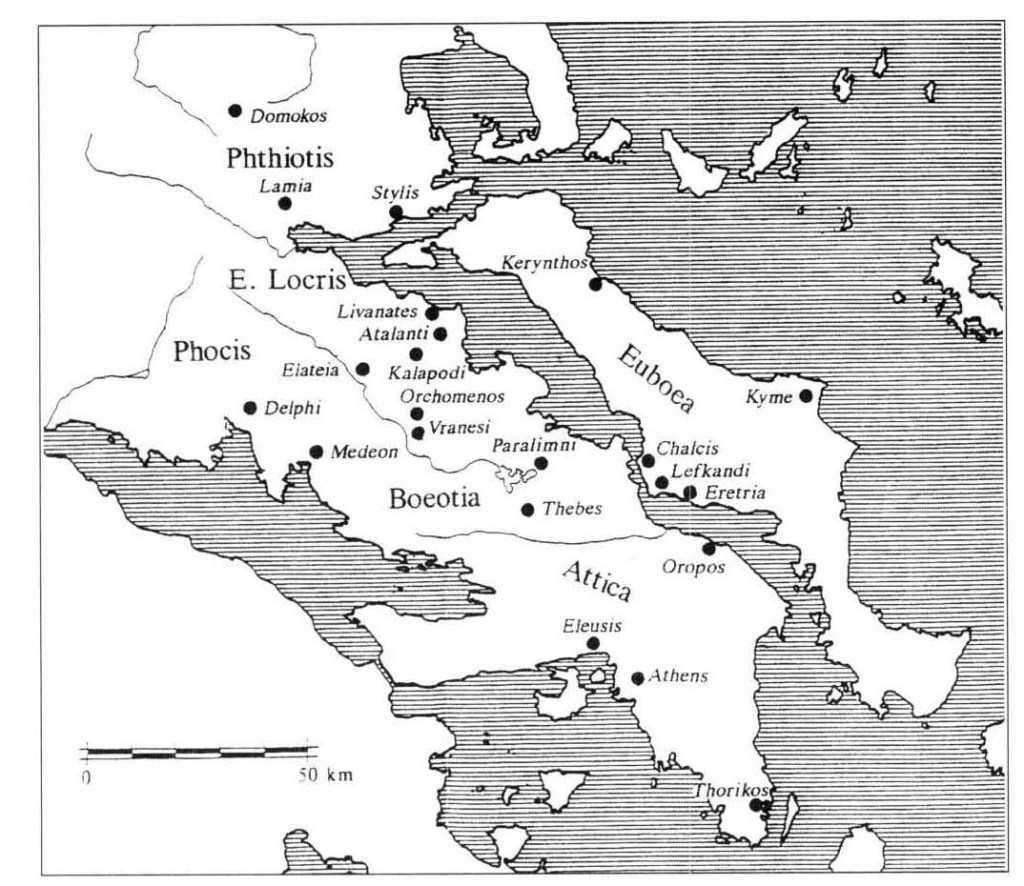
Figure 9. Map of central Greece showing sites represented in the pilot corpus. Inscriptions in this dataset come from Euboea and Athens, spanning from the mid-8th to the 6th century BCE.
Why It Matters
APEX is built on the belief that we can do more than just describe the evolution of early scripts—we can measure it. Traditional paleography has long relied on trained visual intuition, the expert eye that can recognize when a letterform “feels” earlier, or more formal, or distinctly local. But those impressions are rarely made explicit. What does “formal” actually mean, visually? How do we know when a script is evolving—and what evidence grounds that claim?
By extracting features like symmetry, stroke logic, and curvature, APEX moves us from descriptive typology to quantitative analysis. My goal isn’t to flatten nuance, but to build a system where human expertise and computational insight support each other. With interpretable, scaled scores, we can track visual patterns across time, region, and even individual inscriptions. This opens the door to:
Comparing sites and styles numerically
Generating new hypotheses about regional transmission
Detecting stylistic outliers that may point to forgery, imitation, or cultural contact
It also challenges long-held assumptions in the field. Dating inscriptions, for example, often involves matching a given form to an established visual lineage—but this can slip into circular logic. If “archaic” forms are defined by early dates, and dates are inferred from “archaic” forms, then the system reinforces itself without new evidence. APEX introduces a third axis: one grounded in measurable, replicable features. That doesn’t replace context or typology—it adds another layer of rigor.
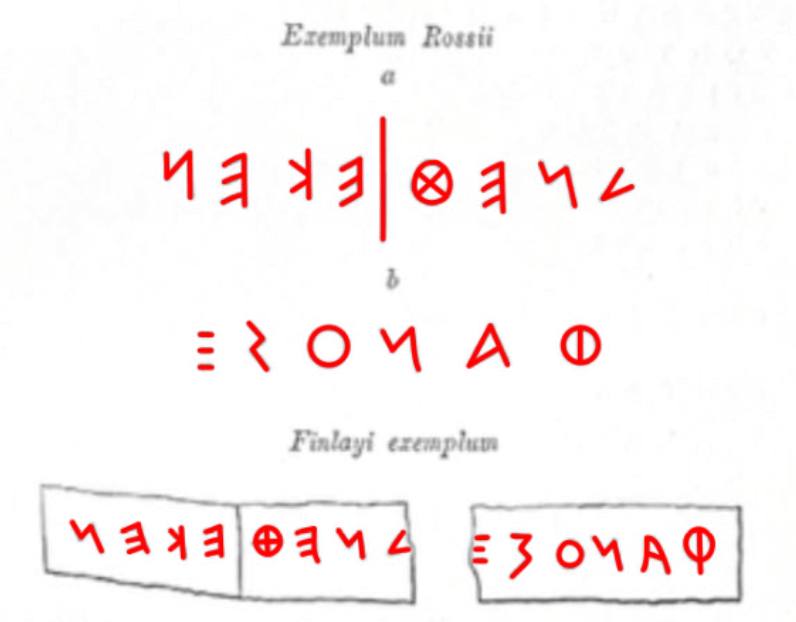
Dipylon: When the Data Doesn’t Flinch
Figure 10a. The Dipylon Oinochoe inscription (drawing from IG I³). One of the two earliest alphabetic inscriptions in Greek, dated to the mid-8th century BCE.Figure 10b. Athenian dedication, 6th century BCE. This tracing was the point of comparison in complexity scoring—despite being later, it registered as more visually complex than Dipylon in my initial analysis.
One of the earliest inscriptions I’ve run through the system is also one of the most famous: the Dipylon inscription, dated to the mid-8th century BCE and long celebrated as a watershed moment in the history of the Greek alphabet. It’s an obvious case study, and I expected it to stand out—visually unstable, perhaps overly complex, the kind of thing you’d expect from a script just finding its footing.
But it didn’t.
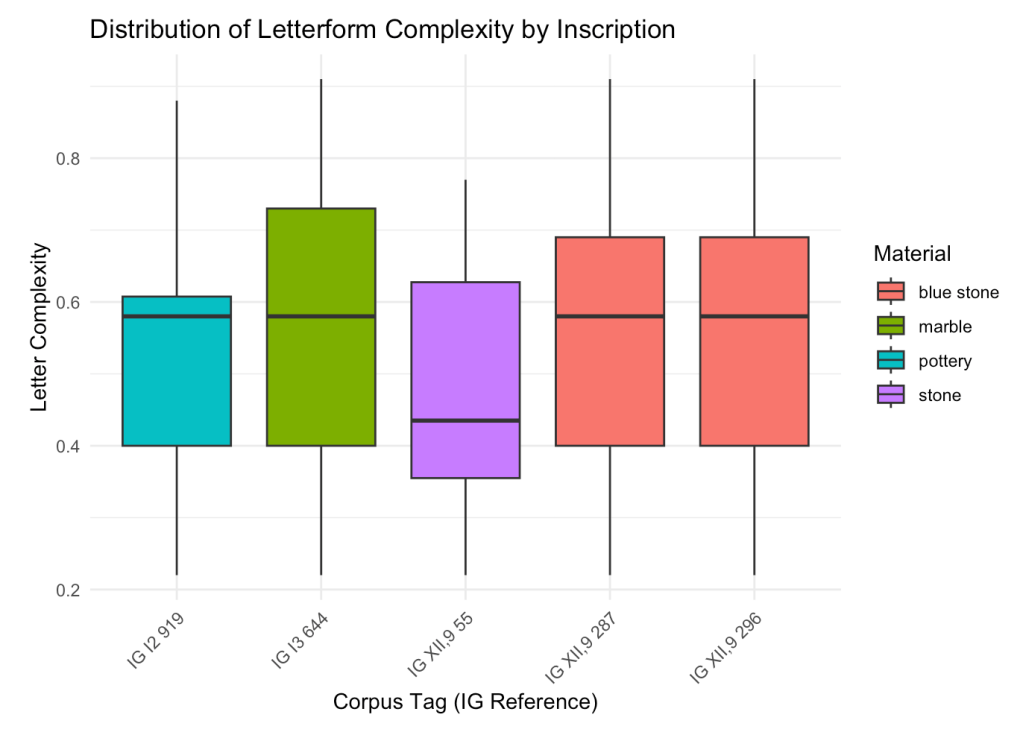
Figure 11. Distribution of letterform complexity scores across five inscriptions. IG I2 919 (blue), the Dipylon oinochoe, shows complexity on par with several later inscriptions, if not lower, challenging assumptions about the visual ‘primitiveness’ of early alphabetic writing.
Dipylon came back as less complex than three of the four texts from 150–250 years later. Not radically so, and I’ll need to test for statistical significance. But the fact that it falls anywhere below later forms is striking. It disrupts the deeply embedded assumption that “early” equals “primitive”—that the alphabet grew from mess into order.
This kind of result is both clarifying and disorienting. It raises a fundamental question about how we define the very metrics we use: what counts as complexity? In APEX, complexity is a weighted composite: more strokes, more intersections, less symmetry, less roundness—these push a letter’s complexity score higher. But those weights are a human decision, my human decision, reflecting a particular theory of visual burden.
I can tune them to better match expert judgment. Or, I can sit with the discomfort when the numbers disagree with what I thought I’d see.
There’s also a caveat that matters: we’re not yet comparing like to like. Right now, the comparison is inscription-to-inscription, which is useful for spotting broad patterns but noisy when it comes to fine-grained typology. Ideally, I’ll be comparing the same letterform, in the same variant, across multiple inscriptions. I have a strong hunch that’s where the real insights will come from.
Until then, Dipylon’s ordinariness serves as provocation and placeholder—reminding us that the past might not be as unruly as we imagine.
What’s Next
This first round of feature extraction was a proof of concept. Now it’s time to scale. Over the next few months, I’ll:
Expand the corpus with more inscriptions from across regions and time periods
Refine the complexity formula, testing both against intuition and against formal criteria
Build a more granular comparison framework, starting with letterform-to-letterform tracking across inscriptions
Prototype an interface to allow structured uploads, human-guided segmentation, and visual feedback
I’m also starting to explore how this data could be used for classification—predicting likely region or century from featural profiles—and what it might take to integrate drawing-based OCR into the workflow for automatic metadata tagging.
The goal isn’t just to process more data. It’s to move toward a toolset that scholars, students, and researchers can use to test hypotheses, challenge assumptions, and see the alphabet’s evolution in a more legible form.
Closing Thoughts
Watching these ancient forms transform—first into vectors, then into numbers, then into patterns—has been equal parts exhilarating and disorienting. APEX is still in its early stages, but already the project is doing what I hoped it would: not just confirming what we think we know, but pressing against it.
There’s still a long way to go. The features need refining. The comparisons need tightening. The visual logic of scripts can’t be reduced to numbers alone. But I believe quantification, when done carefully and transparently, can serve as a new lens. This isn’t the end of the story—just the moment the letters started speaking back.
While the official tool paper is being produced, this post about APEX (Alphabetic Paleography Explorer) will serve as the public introduction to the project. APEX is a first-of-its-kind analytical engine and accompanying database designed to analyze the development and transmission of the Greek alphabet using machine learning, statistical modeling, and quantitative paleography.
But where exactly is APEX right now? And where is it headed? In this post, I’ll outline the five-stage development plan for APEX, explaining how I’ll move from an internally focused Greek dataset to a broader cross-linguistic epigraphic tool.
Before studying the Greek alphabet’s adaptation from Phoenician, we must quantify variation within Greek inscriptions. This stage analyzes regional epichoric scripts to track how city-states adapted letterforms. Critical regions include Euboea, Crete, Cyprus, Ionia, and Rhodes, where early inscriptions provide additional evidence.
Using statistical clustering and geometric analysis, APEX will assess regional patterns, writing materials, and conventions to determine whether Greek scripts developed independently or through coordinated transmission. This foundation will enable precise Greek-Phoenician comparisons in later stages.
Stage 2: Phoenician Integration – Modeling Direct Transmission
The next step is integrating Phoenician inscriptions to identify transmission patterns. I aim to identify which phase of Phoenician script aligns with early Greek inscriptions, determining if different Greek alphabets adopted letters at varying times, and assessing how Greek phonemic structure influenced letterform changes.
Using clustering algorithms and Principal Component Analysis (PCA), APEX will map transmission chronologically, determining whether the Greek alphabet spread through a single event or multiple independent adaptations. This will clarify not just when and where transmission occurred, but how Greek speakers modified Phoenician letters.
Stage 3: Refining Transmission Models – Alternative Pathways & Outliers
APEX’s Greek-Phoenician alignment model will be tested against alternative hypotheses to avoid oversimplified interpretations.
Research areas include investigating whether intermediary influences from Anatolia, Egypt, or Cyprus contributed to transmission, identifying Greek letterforms that do not match expected Phoenician prototypes, and assessing whether Greek city-states adopted the alphabet at different times rather than through a single event.
Anomaly detection will highlight deviations from expected transmission patterns, testing whether they resulted from dialectal differences, misinterpretations, or other factors. The result will be a refined computational model that accounts for variability in script adoption.
Stage 4: Expansion to Other Scripts – Comparative Alphabet Transmission
With a validated Greek-Phoenician transmission model, APEX will expand to other writing systems, including Aramaic, a key comparative script case; Etruscan and Coptic, which modified the Greek alphabet for non-Indo-European languages; and Iberian scripts, which followed distinct adaptation patterns.
This stage will test whether APEX’s Greek-Phoenician model can be applied to other scripts using transfer learning, revealing broader principles of alphabetic transmission. By this stage, APEX will transition from a Greek-focused project into a generalized computational tool for paleographic analysis.
Stage 5: Public Usability – An Accessible Epigraphy Tool
The final stage transforms APEX into a widely usable resource. The main developments include an interactive web interface for querying inscriptions and visualizing transmission models, AI-assisted tools for reconstructing missing letterforms, and data visualizations accessible to historians, archaeologists, and linguists. At this stage, users will be able to propose and test hypotheses, generating maps, timelines, and animations of letterform change over time.
Conclusion
APEX is a name that is both fitting and ironic. It suggests a peak, a culmination—yet this project is only at its beginning. In the study of writing systems, it is not the final word on alphabetic transmission but the first structured step towards globally quantifying it.
But here’s why the name truly fits: archaeologically, the apex of a stratigraphy is not an endpoint, but where excavation begins—the surface layer, the threshold to deeper histories. APEX is that surface we are breaking. We are just beginning to dig, uncovering the structures hidden beneath. And like any good excavation, what we uncover will challenge dearly held beliefs.
For reflections, milestones, and field notes, visit my public research journal, To Wake the Dead.